Bitcoin Realized Profit to Loss Ratio#
Definition#
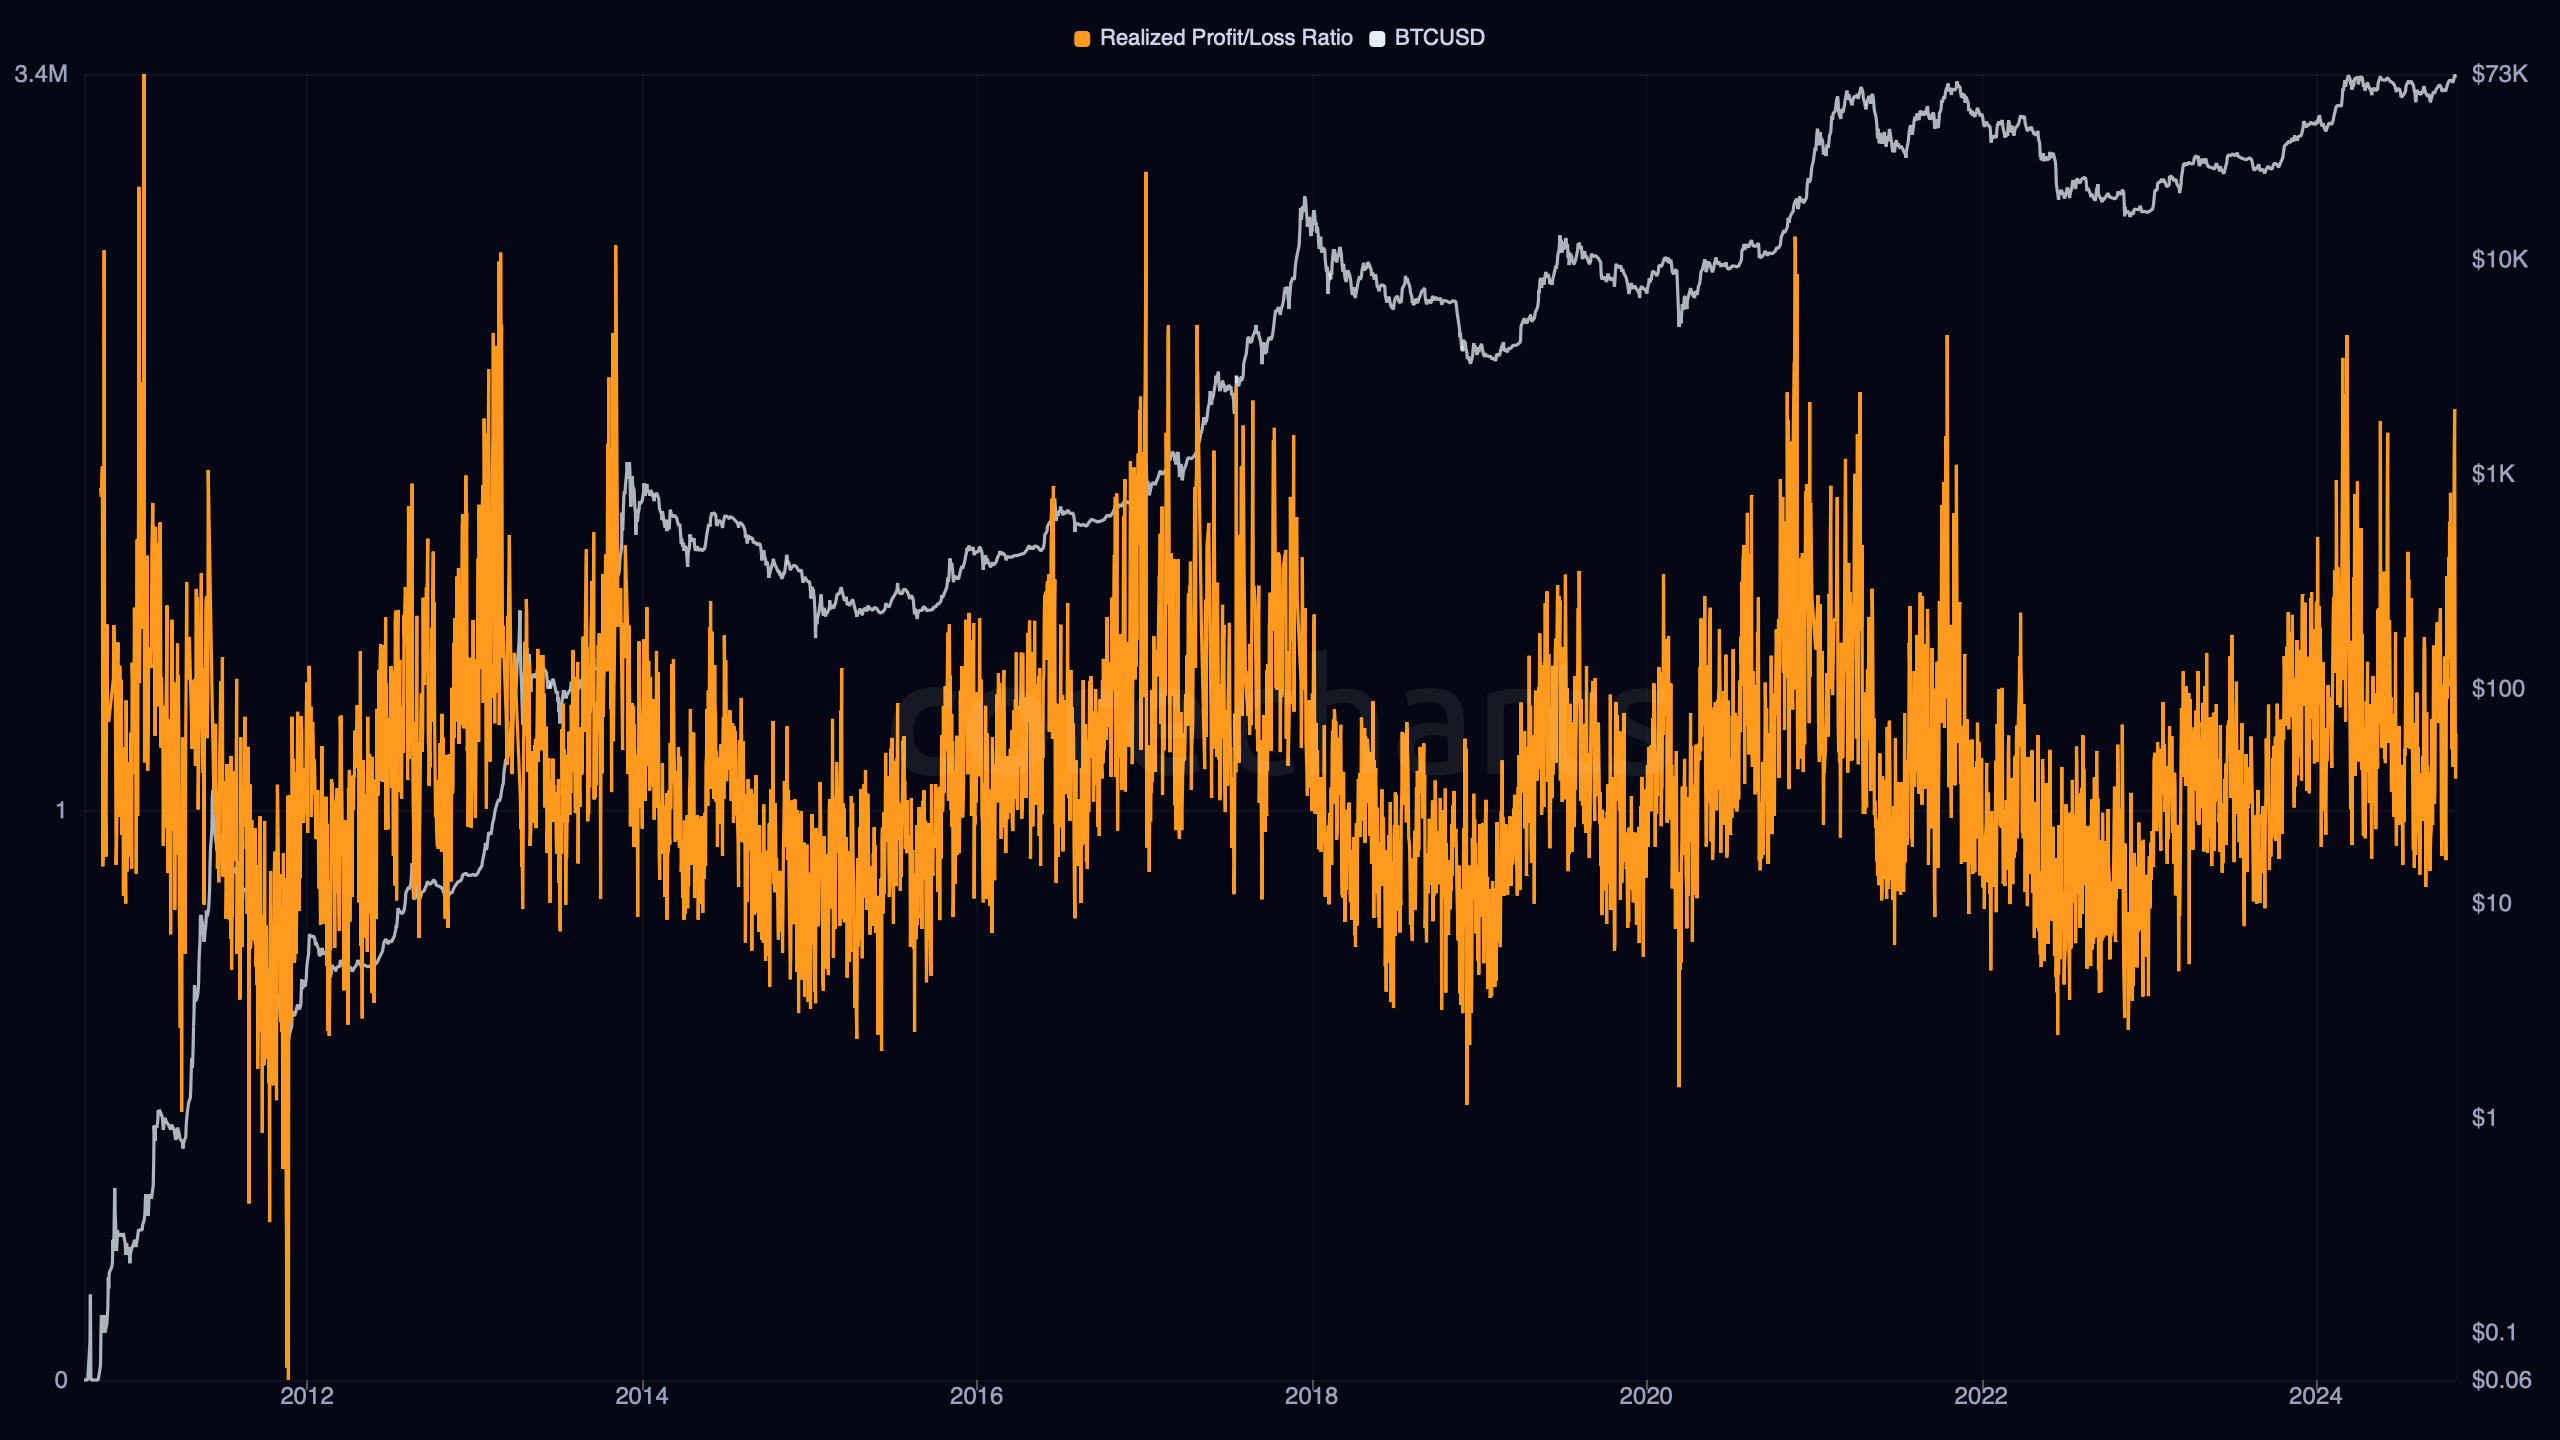
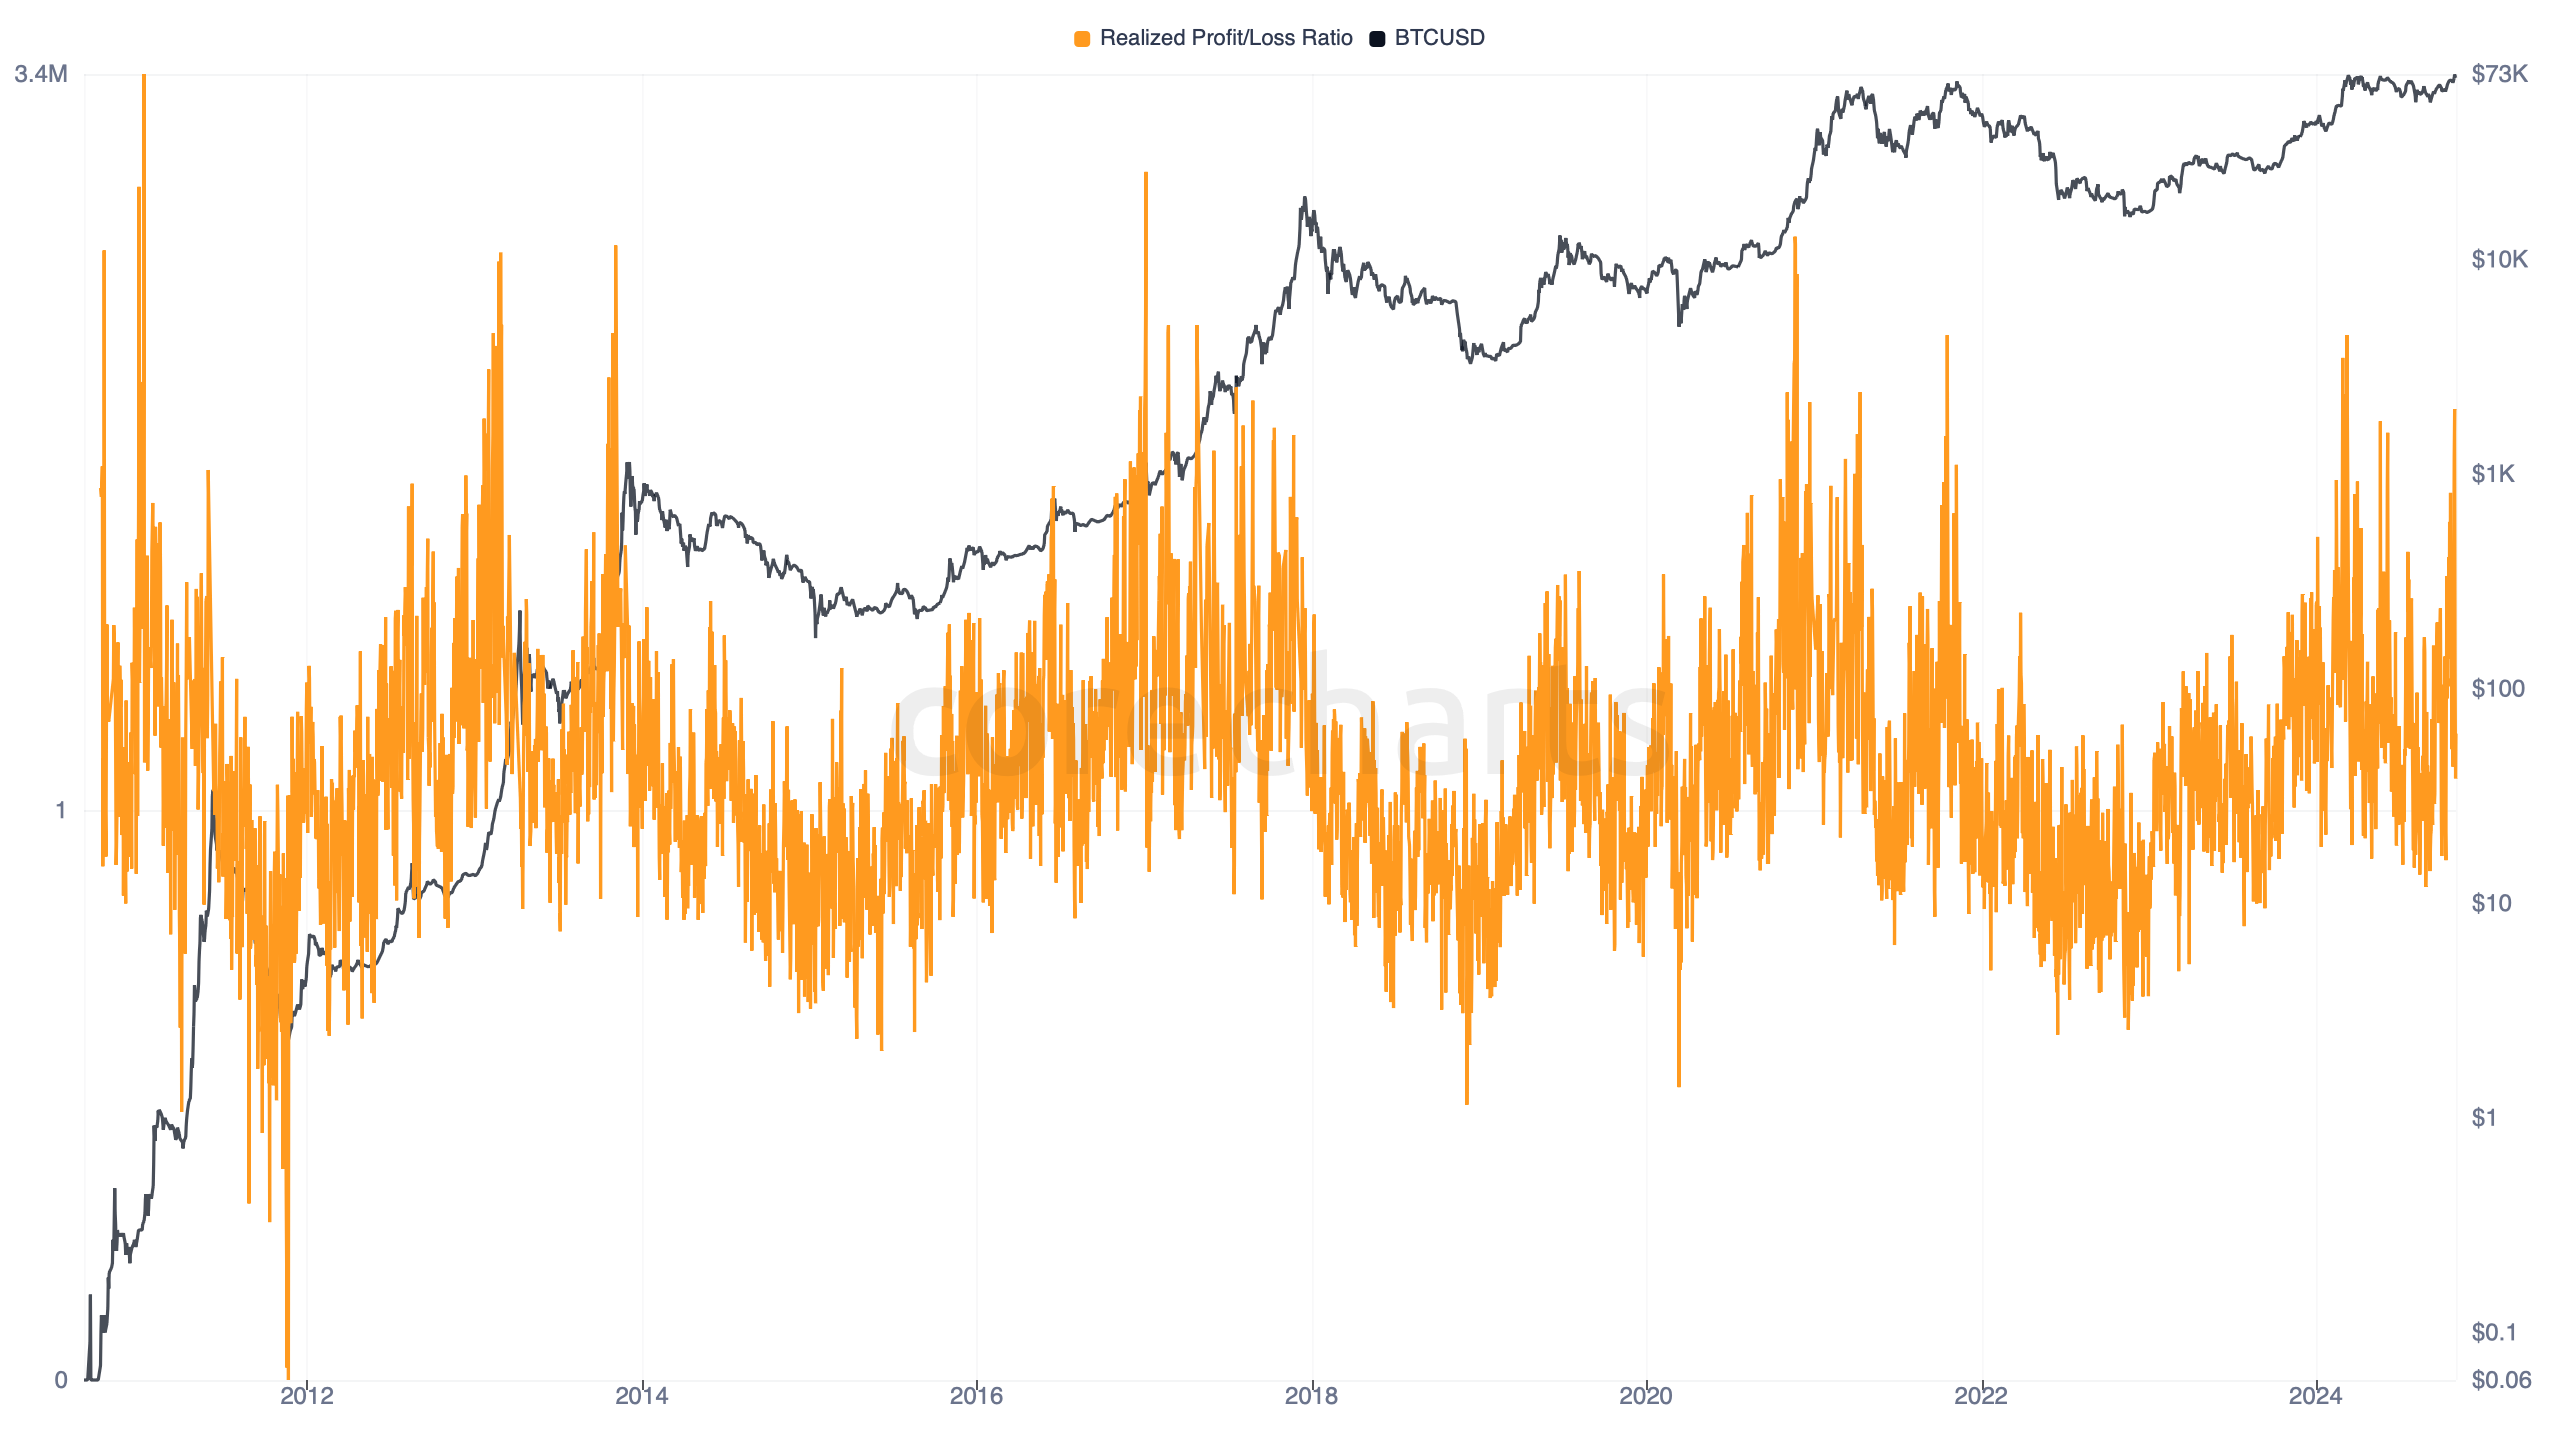
Bitcoin Realized Profit to Loss Ratio divides daily realized profit by daily realized loss.
The unit is dimensionless. Values above 1 mean profit realization exceeded loss realization. Values below 1 mean loss realization dominated.
The ratio keeps relative balance and discards net sign magnitude in USD. A day with very small realized profit and loss can print the same ratio as a day with very large realized profit and loss.
Interpretation#
High readings mark profit-dominant spending. That usually appears in constructive trends, distribution waves after sustained upside, or sharp rebounds that let coins move well above cost basis.
Low readings mark loss-dominant spending. Those prints tend to cluster around capitulation, breakdowns, or stressful post-peak phases when spent coins are clearing below prior acquisition levels.
Readings near 1 mark rough balance between realized profit and realized loss. That can happen in transitional phases, but also on active days when both legs are large and close in size.
Price And Market Regime#
Profit-Dominant Spending#
When the ratio moves decisively above 1, spent-output flow is tilted toward gains. That does not mean the whole network is in profit. It means the coins actually moving that day are realizing more profit than loss.
Extreme upside in the ratio can also come from a shrinking loss denominator. The signal is strongest when paired with the gross components, because the same ratio can arise from very different profit and loss totals.
Loss-Dominant Spending#
Readings below 1 mark days when realized loss outweighed realized profit. Persistent sub-1 regimes usually align with weak conditions in spent-output flow and with heavier capitulation pressure.
The ratio is especially sensitive around the crossover zone. A move through 1 changes the dominant side of realized P/L even if the absolute dollar values are not extreme.
Relationship to other metrics#
Realized Profit and Realized Loss are the two direct inputs. The ratio keeps their relative balance. NRPL keeps their net difference in USD.
Net Realized Profit/Loss can be large while the ratio stays moderate if both realized profit and realized loss are large. The ratio can be extreme while NRPL stays modest if one side collapses toward zero.
Methodology Note#
CoreCharts computes this metric as daily realized_profit_usd / realized_loss_usd. That makes it a balance metric inside realized flow, not a valuation metric and not a measure of unrealized holder state.