Bitcoin Spent Output Profit Ratio#
Definition#
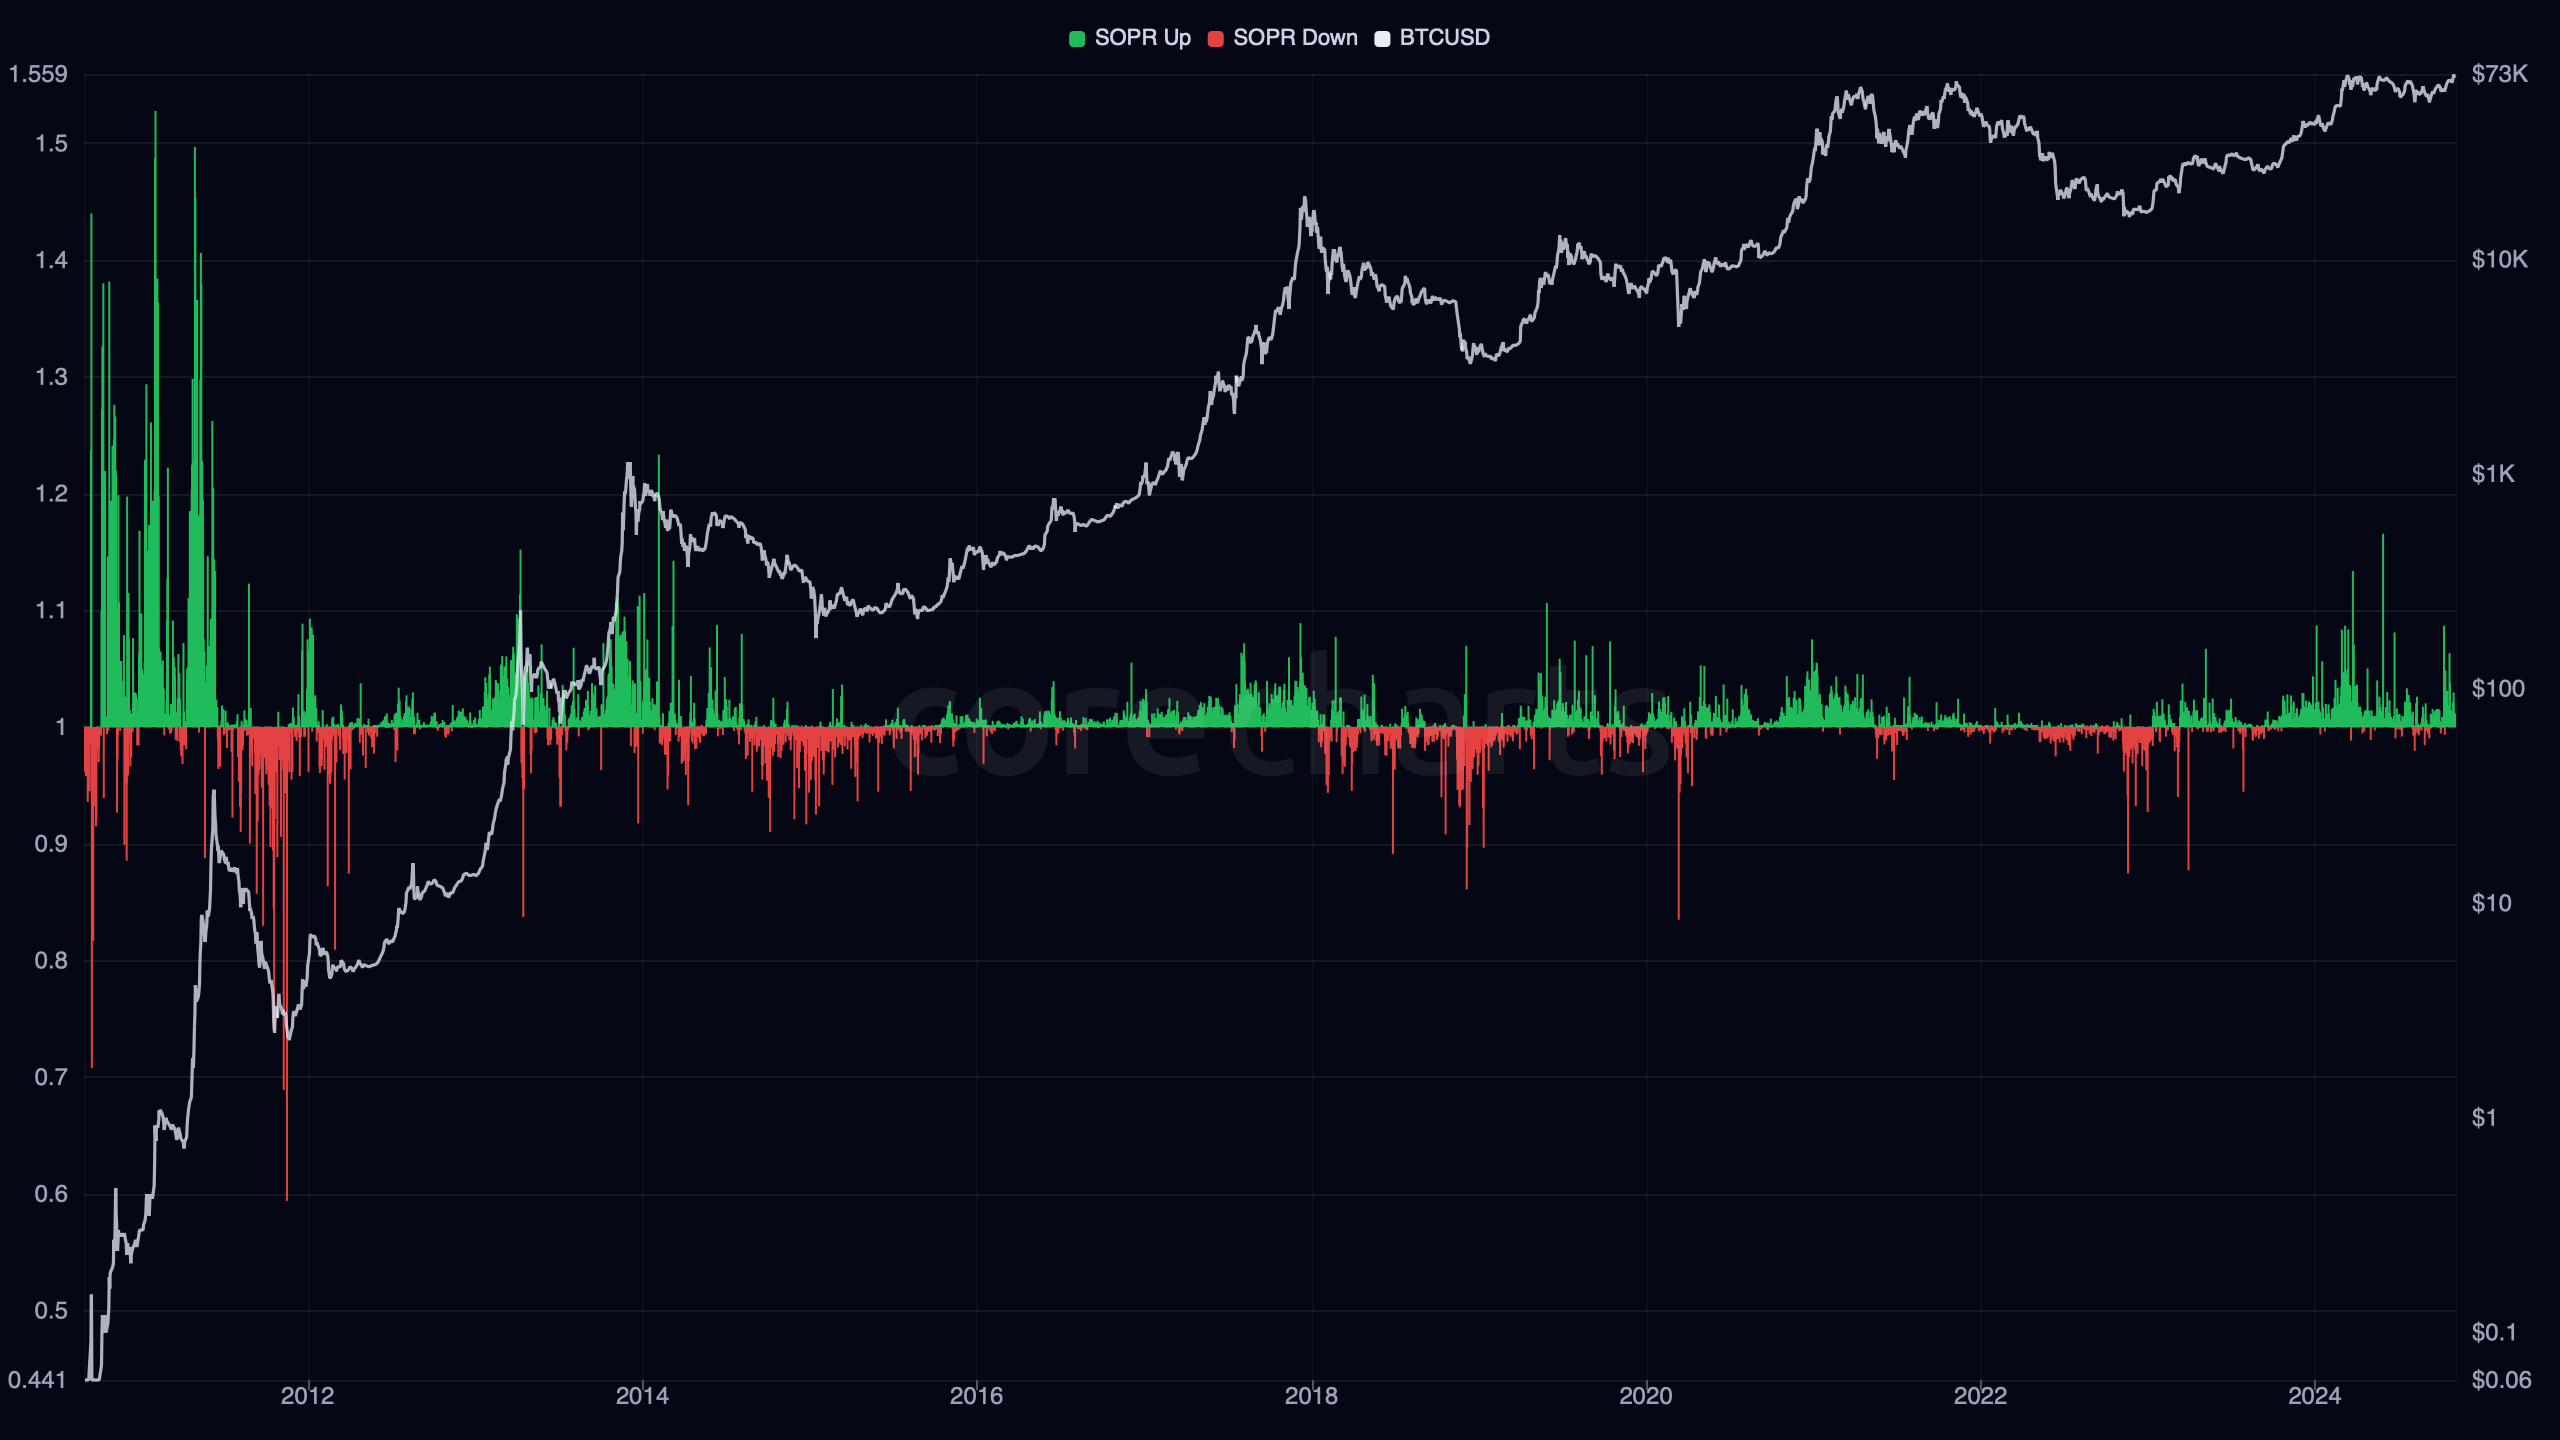
Bitcoin Spent Output Profit Ratio measures the average realized value multiple of coins spent on-chain relative to their cost basis. The series is built from spent outputs, not from the full outstanding supply.
In CoreCharts, the daily ratio compares the USD value of spent coins at the time they are spent with the USD value of those same coins at the time they were created.
SOPR is value-weighted: the ratio sums USD amounts rather than averaging per-output ratios, so a small number of large or old spent coins can pull the daily reading.
A reading above 1 means spent coins were realized above cost basis on average. A reading below 1 means spent coins were realized below cost basis. A reading near 1 places spent outputs close to break-even.
Coins that do not move are excluded from the series.
Interpretation#
High SOPR means the coins actually moving that day are realizing gains relative to their prior on-chain acquisition price. That often appears after upside continuation, during distribution, or during strong rebounds that lift spent supply well above cost basis.
Low SOPR means the moved coins are being spent below cost basis on average. That condition clusters more often in stress events, sharp drawdowns, and post-peak damage.
Values around 1 matter because they mark spend-side break-even. In Bitcoin, that zone often becomes behaviorally sticky. Coins approaching break-even are more likely to meet selling pressure than coins already far in profit.
Price And Market Regime#
Profit-Realization Regimes#
A sustained stretch above 1 means the market is realizing gains through spent outputs. The point is specific: the coins moving that day are clearing with embedded profit.
The magnitude still depends on who is moving. Old low-cost coins can keep SOPR elevated even when spent BTC volume is not extreme.
Loss-Realization Regimes#
A sustained stretch below 1 means spent coins are clearing at a loss. That is closer to capitulation flow than to broad holder state.
The whole network does not need to be underwater for SOPR to trade below 1. The condition only requires the moved cohort to be underwater on average.
Relationship to other metrics#
Realized Profit and Realized Loss keep the gross USD legs. SOPR compresses that spend-side P/L into a single ratio.
NRPL keeps the net USD difference between realized profit and realized loss. SOPR keeps relative profitability at the level of spent outputs.
STH SOPR and LTH SOPR split the same logic by holder maturity. The all-coins series can stay stable while the two cohort series diverge sharply.
Methodology Note#
CoreCharts computes SOPR from USD value at spend time versus USD value at prior creation time for spent outputs. The cohort variants use the same profit-ratio logic and split the spent set by holding age.
The all-coins SOPR is not adjusted SOPR. Very short-lived outputs are not stripped out here by a separate aSOPR-style filter in the final series label.
Metric Origin#
SOPR was introduced by Renato Shirakashi in 2019.