Metric Summary Cards#
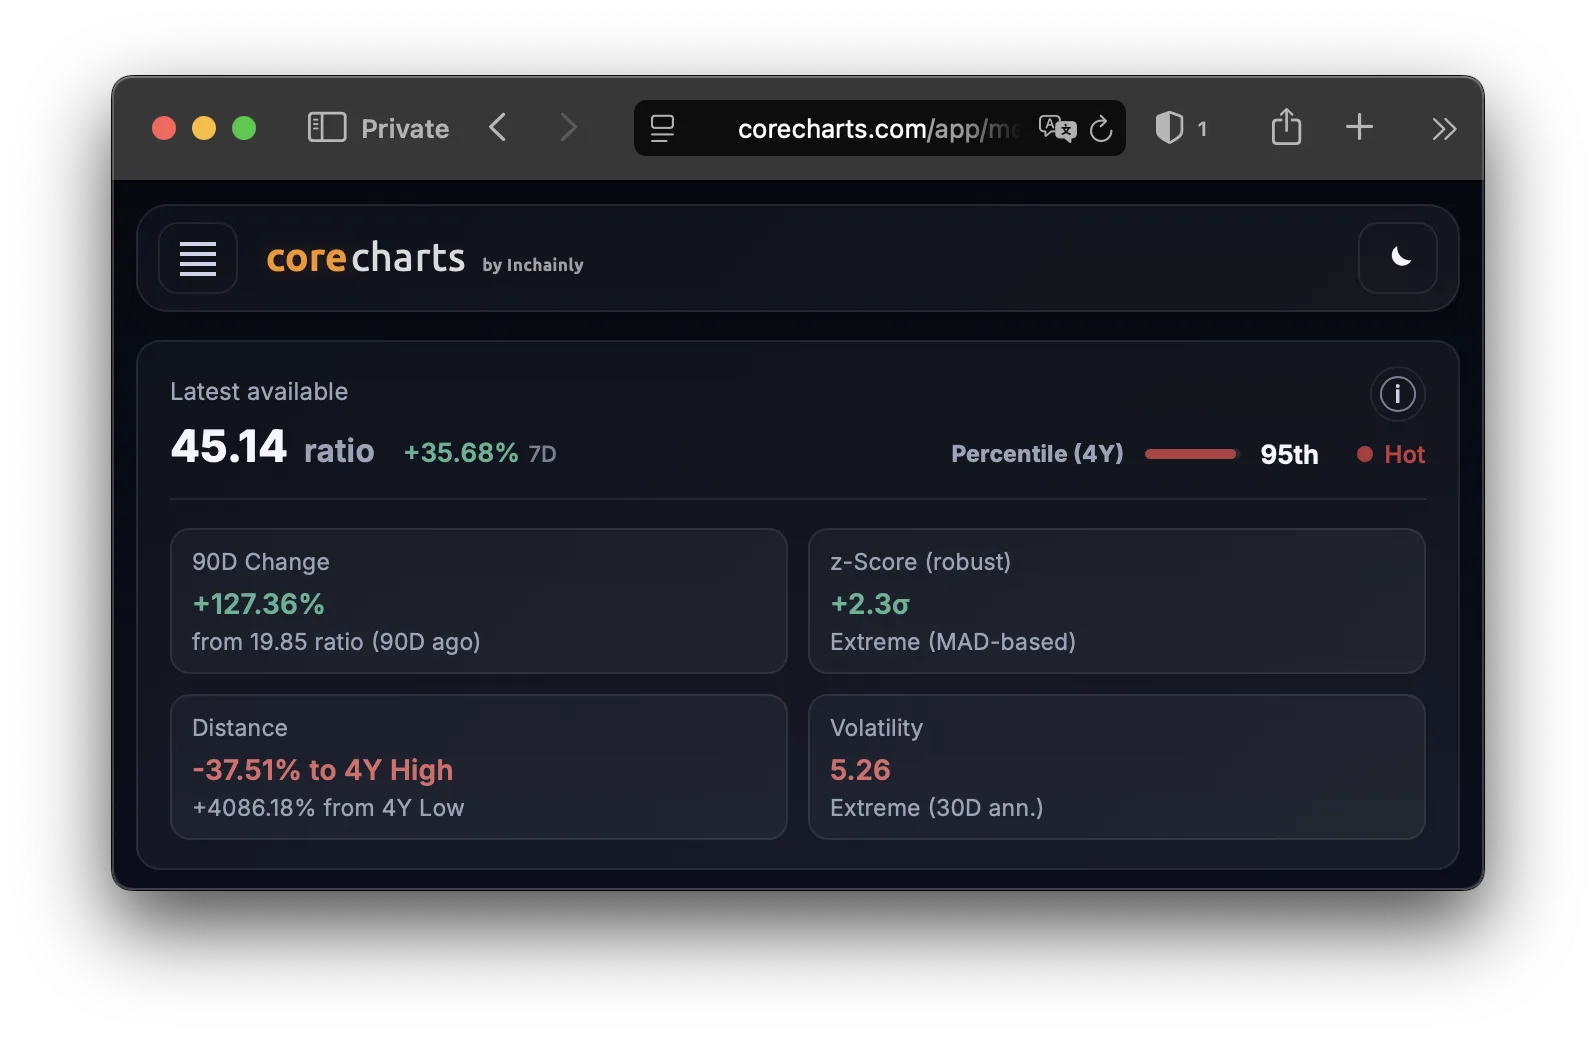
These cards give a compact readout of the selected series and place the latest value into statistical context.
Current value#
The latest available data point of the selected series.
Values are displayed in compact form such as K, M, B, and T when appropriate, while still preserving meaningful decimals.
Percentile (4Y) and Zone#
Percentile shows where the current value sits within the last 4 years of daily data, using up to 1460 observations.
If the series is shorter than 4 years, all available history is used instead. If fewer than 90 observations are available, the percentile is hidden.
Zone groups that percentile into broad ranges for faster interpretation:
- Cold — below the 10th percentile
- Cool — 10th to 25th percentile
- Neutral — 25th to 75th percentile
- Warm — 75th to 90th percentile
- Hot — 90th percentile and above
7D change#
90D change#
The line reading from ... (90D ago) shows the actual value from 90 days earlier:
Distance#
Shows how far the current value is from the extremes of the same 4-year window used for the percentile. If 4 years of data are not available, full history is used instead.
To 4Y High#
Example: −67% to 4Y High means the current value is 67% below the 4-year high.
From 4Y Low#
Example: +414% from 4Y Low means the current value is 414% above the 4-year low.
z-Score (robust)#
A 365-day robust z-score based on the median and MAD, or Median Absolute Deviation.
The factor 1.4826 rescales MAD so it is comparable to standard deviation under a normal distribution.
The label, such as Normal, Elevated, or Extreme, follows common cutoffs around ±1σ and ±2σ.
Volatility#
30-day annualized volatility based on log returns.
This value is only computed for strictly positive series.
Notes#
All windows assume daily data.
Missing or non-finite values are skipped. If the series is shorter than a given window, all available data is used instead.