Bitcoin Short-Term Holder Spent Output Profit Ratio#
Definition#
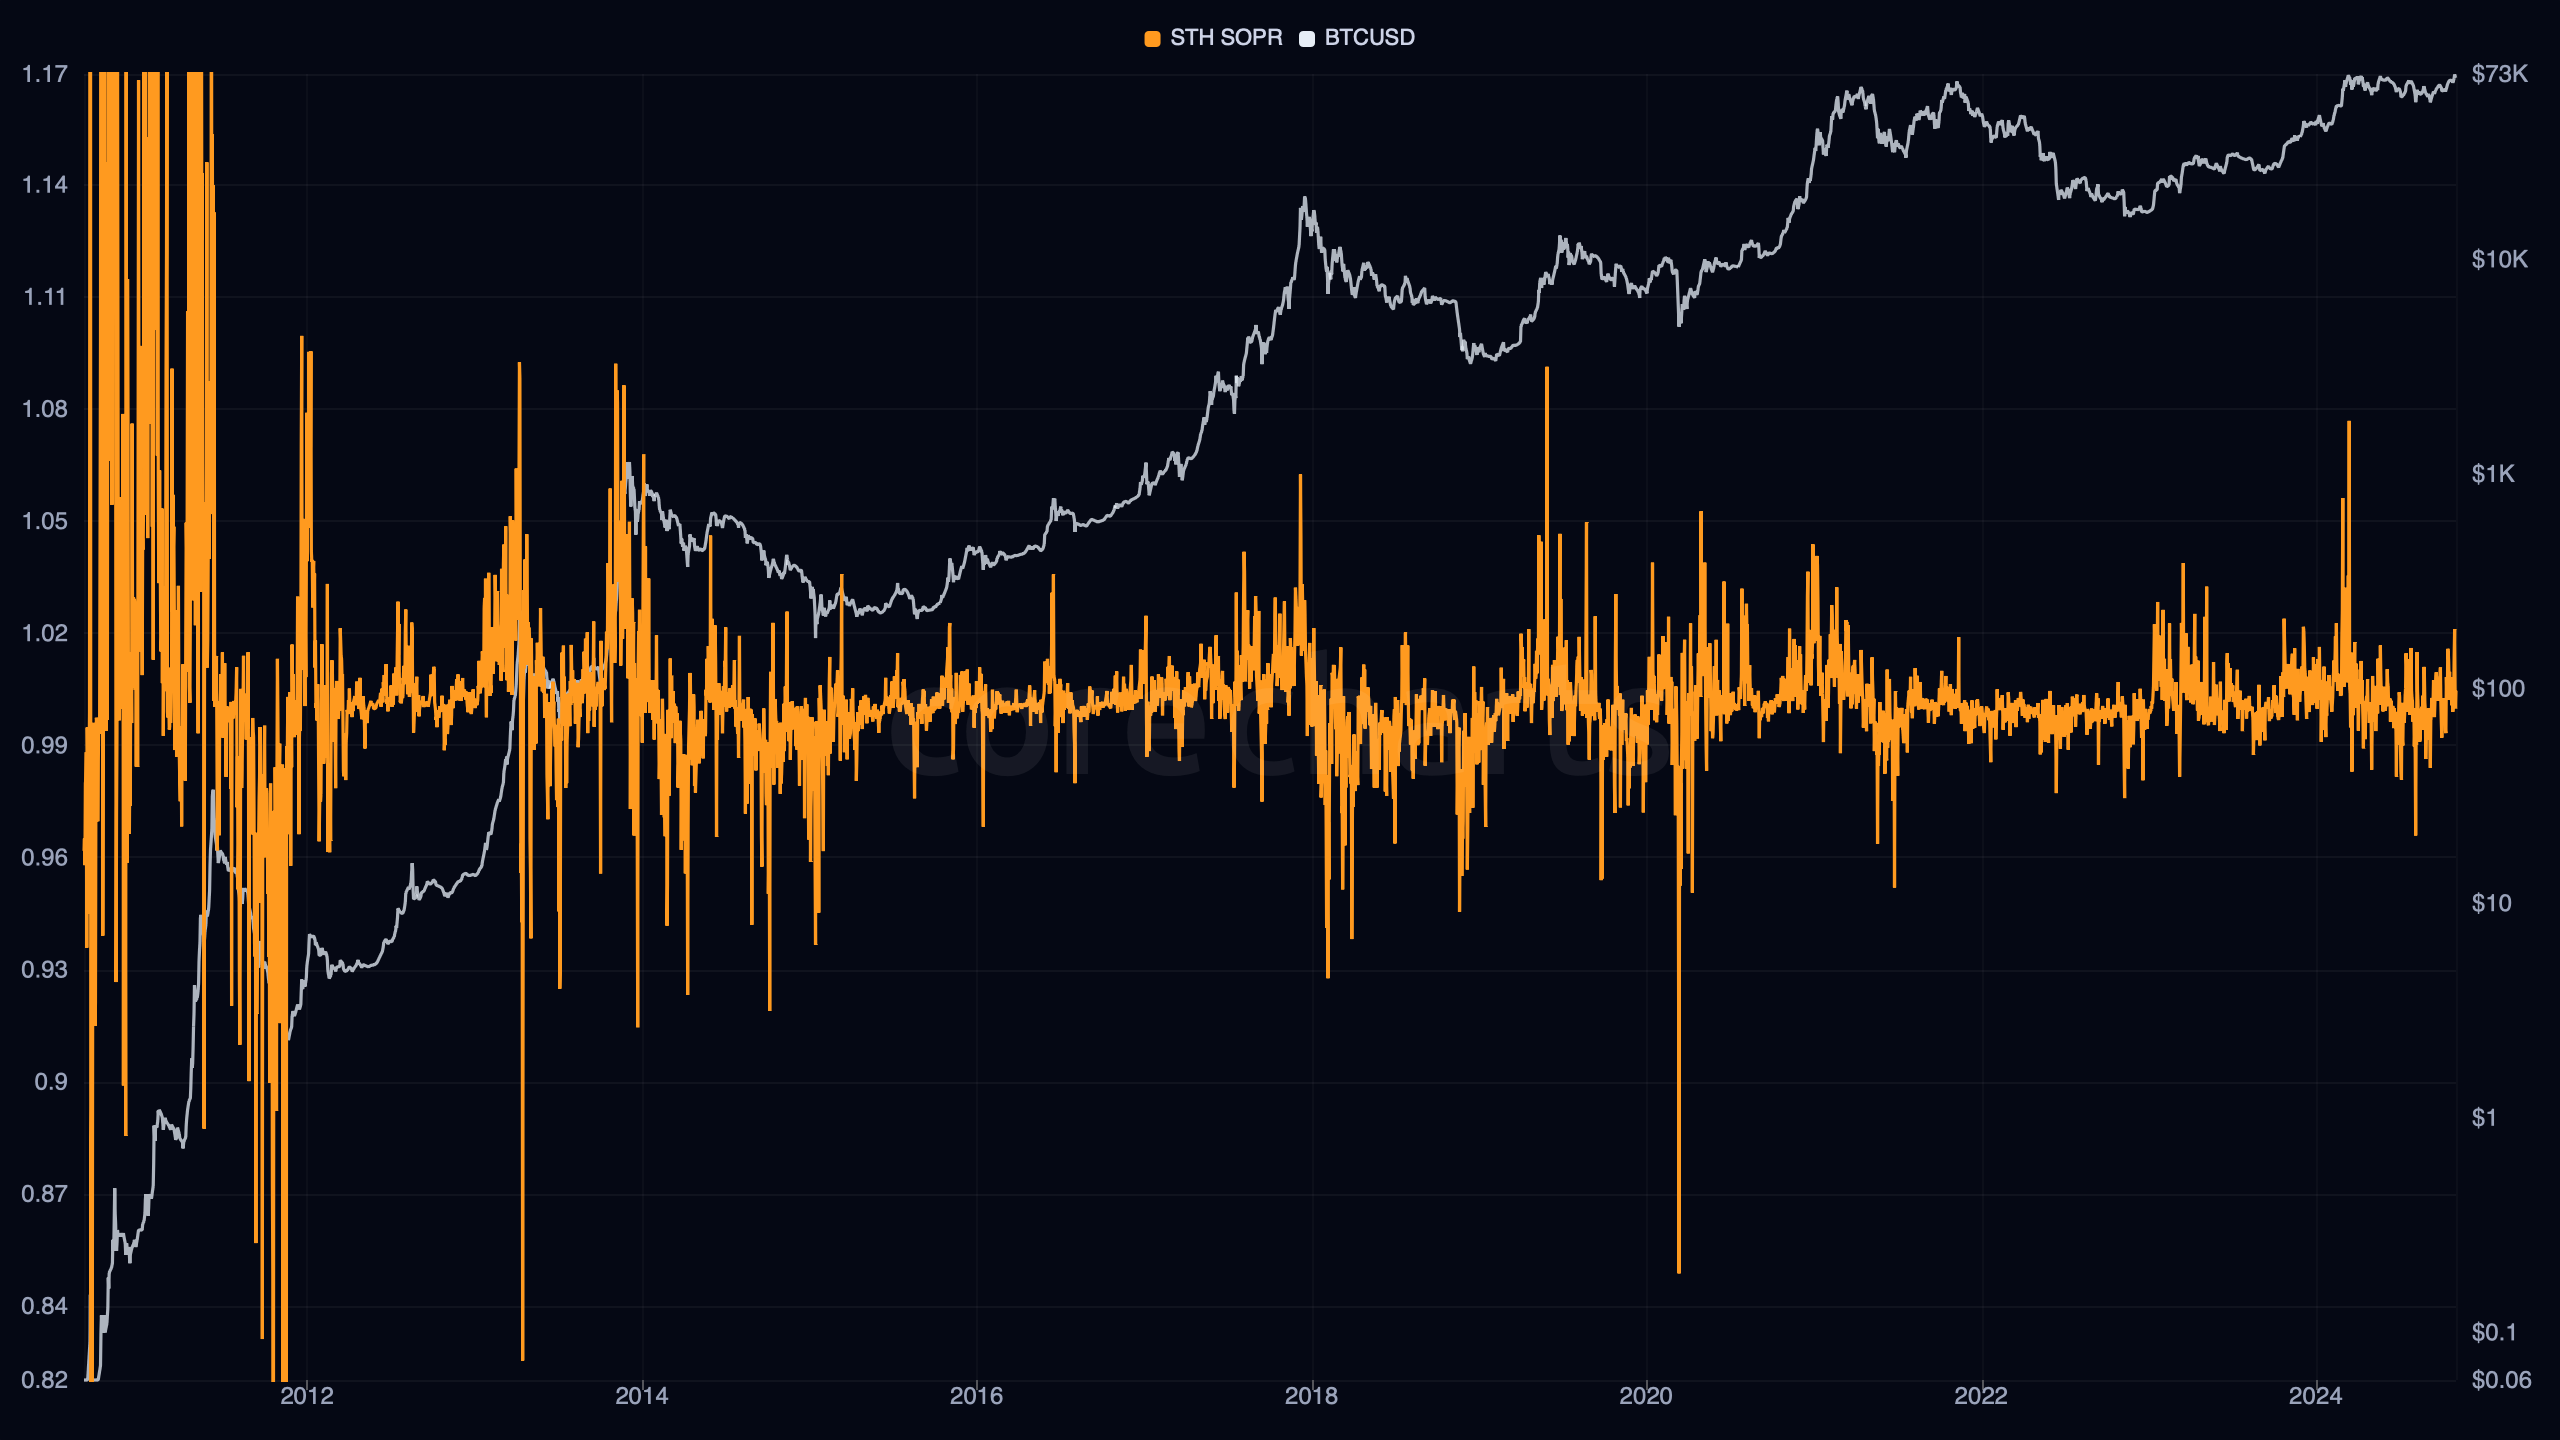
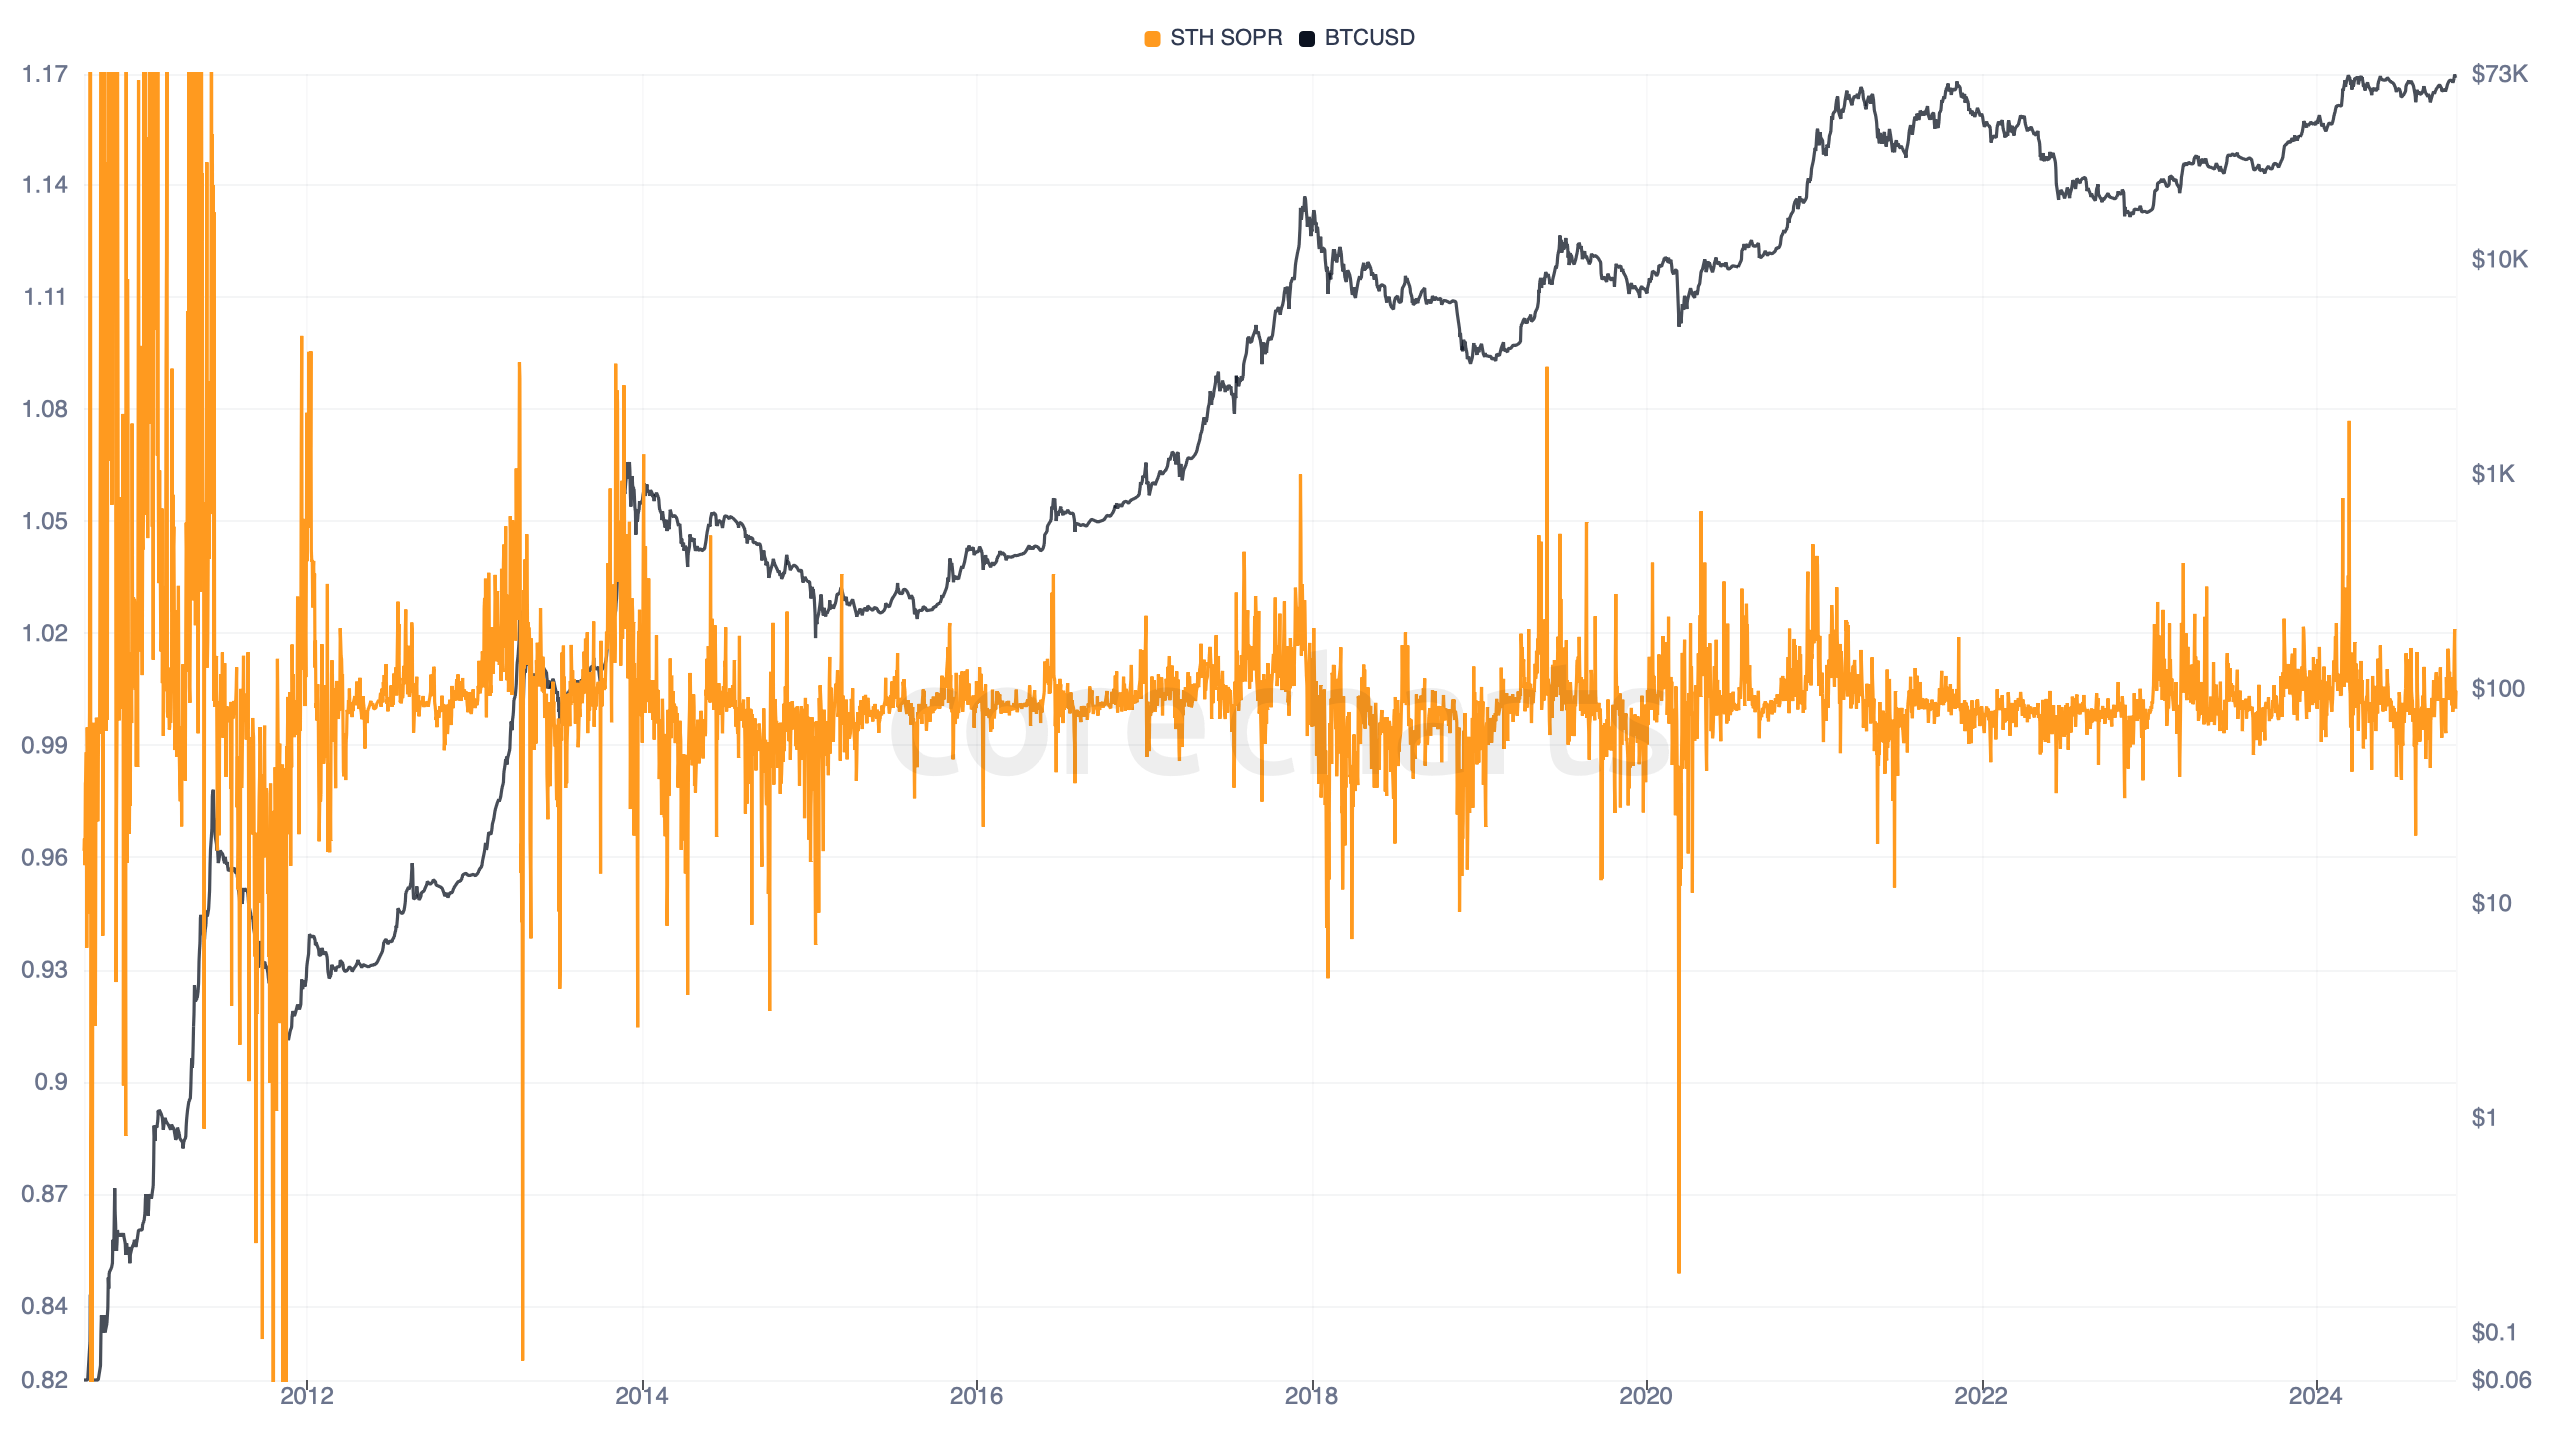
Bitcoin Short-Term Holder Spent Output Profit Ratio applies the SOPR calculation to the younger part of spent supply. In CoreCharts, this is the short-term side of the SOPR family.
The ratio keeps the same structure as aggregate SOPR:
The difference is cohorting. The spent outputs are weighted into the short-term side of the holder split, which in CoreCharts is implemented with a soft transition centered around 155 days, not a hard cliff.
This version reacts faster to recent buyer behavior. Coins acquired closer to the current market tend to have tighter distance to break-even, so small price moves can change the ratio quickly.
Interpretation#
STH SOPR usually reacts faster than aggregate SOPR. Recent buyers have higher turnover, shallower cost-basis dispersion, and less room to absorb drawdowns before moving around break-even.
Readings above 1 mean recently acquired coins are being spent in profit on average. Readings below 1 mean the same cohort is locking in losses. Around 1, the market is clearing close to short-term holder cost basis.
This ratio often becomes especially reactive during local pullbacks and local recoveries. Recent holders are the cohort most likely to test break-even, reject there, then flip back through it with price.
Price And Market Regime#
Break-Even Friction#
The break-even zone matters more here than in LTH SOPR. Recent supply clusters closer to spot, so short-term holder behavior tends to bunch around the 1 line.
That is why STH SOPR often behaves like a live stress gauge for local trend strength. Clean acceptance above 1 points to profitable turnover. Repeated rejection under 1 points to recent buyers spending at a loss.
Reflexive Pullback Regimes#
During corrections inside broader uptrends, STH SOPR often weakens first. Recent entrants get pushed toward loss faster than older supply.
Recovery phases often show the reverse sequence. STH SOPR can recover above 1 before broader holder profitability looks fully repaired across the market.
Relationship to other metrics#
SOPR is the full spent-output series across all ages. STH SOPR isolates the younger side and removes part of the stabilizing effect from older supply.
LTH SOPR usually moves more slowly and can remain elevated while STH SOPR is already under pressure. That divergence often marks stress concentrated in recent buyers rather than in mature holders.
Supply in Profit and Supply in Loss are state metrics for current supply. STH SOPR stays on moved coins only.
Methodology Note#
CoreCharts does not use a hard 155-day cutoff for the STH/LTH SOPR split. The cohort boundary is soft, centered around 155 days, so spent outputs near that age are weighted rather than assigned by a sharp binary switch.
That makes the STH and LTH variants smoother around the cohort boundary than a hard-threshold implementation.