Bitcoin Supply in Profit#
What It Measures#
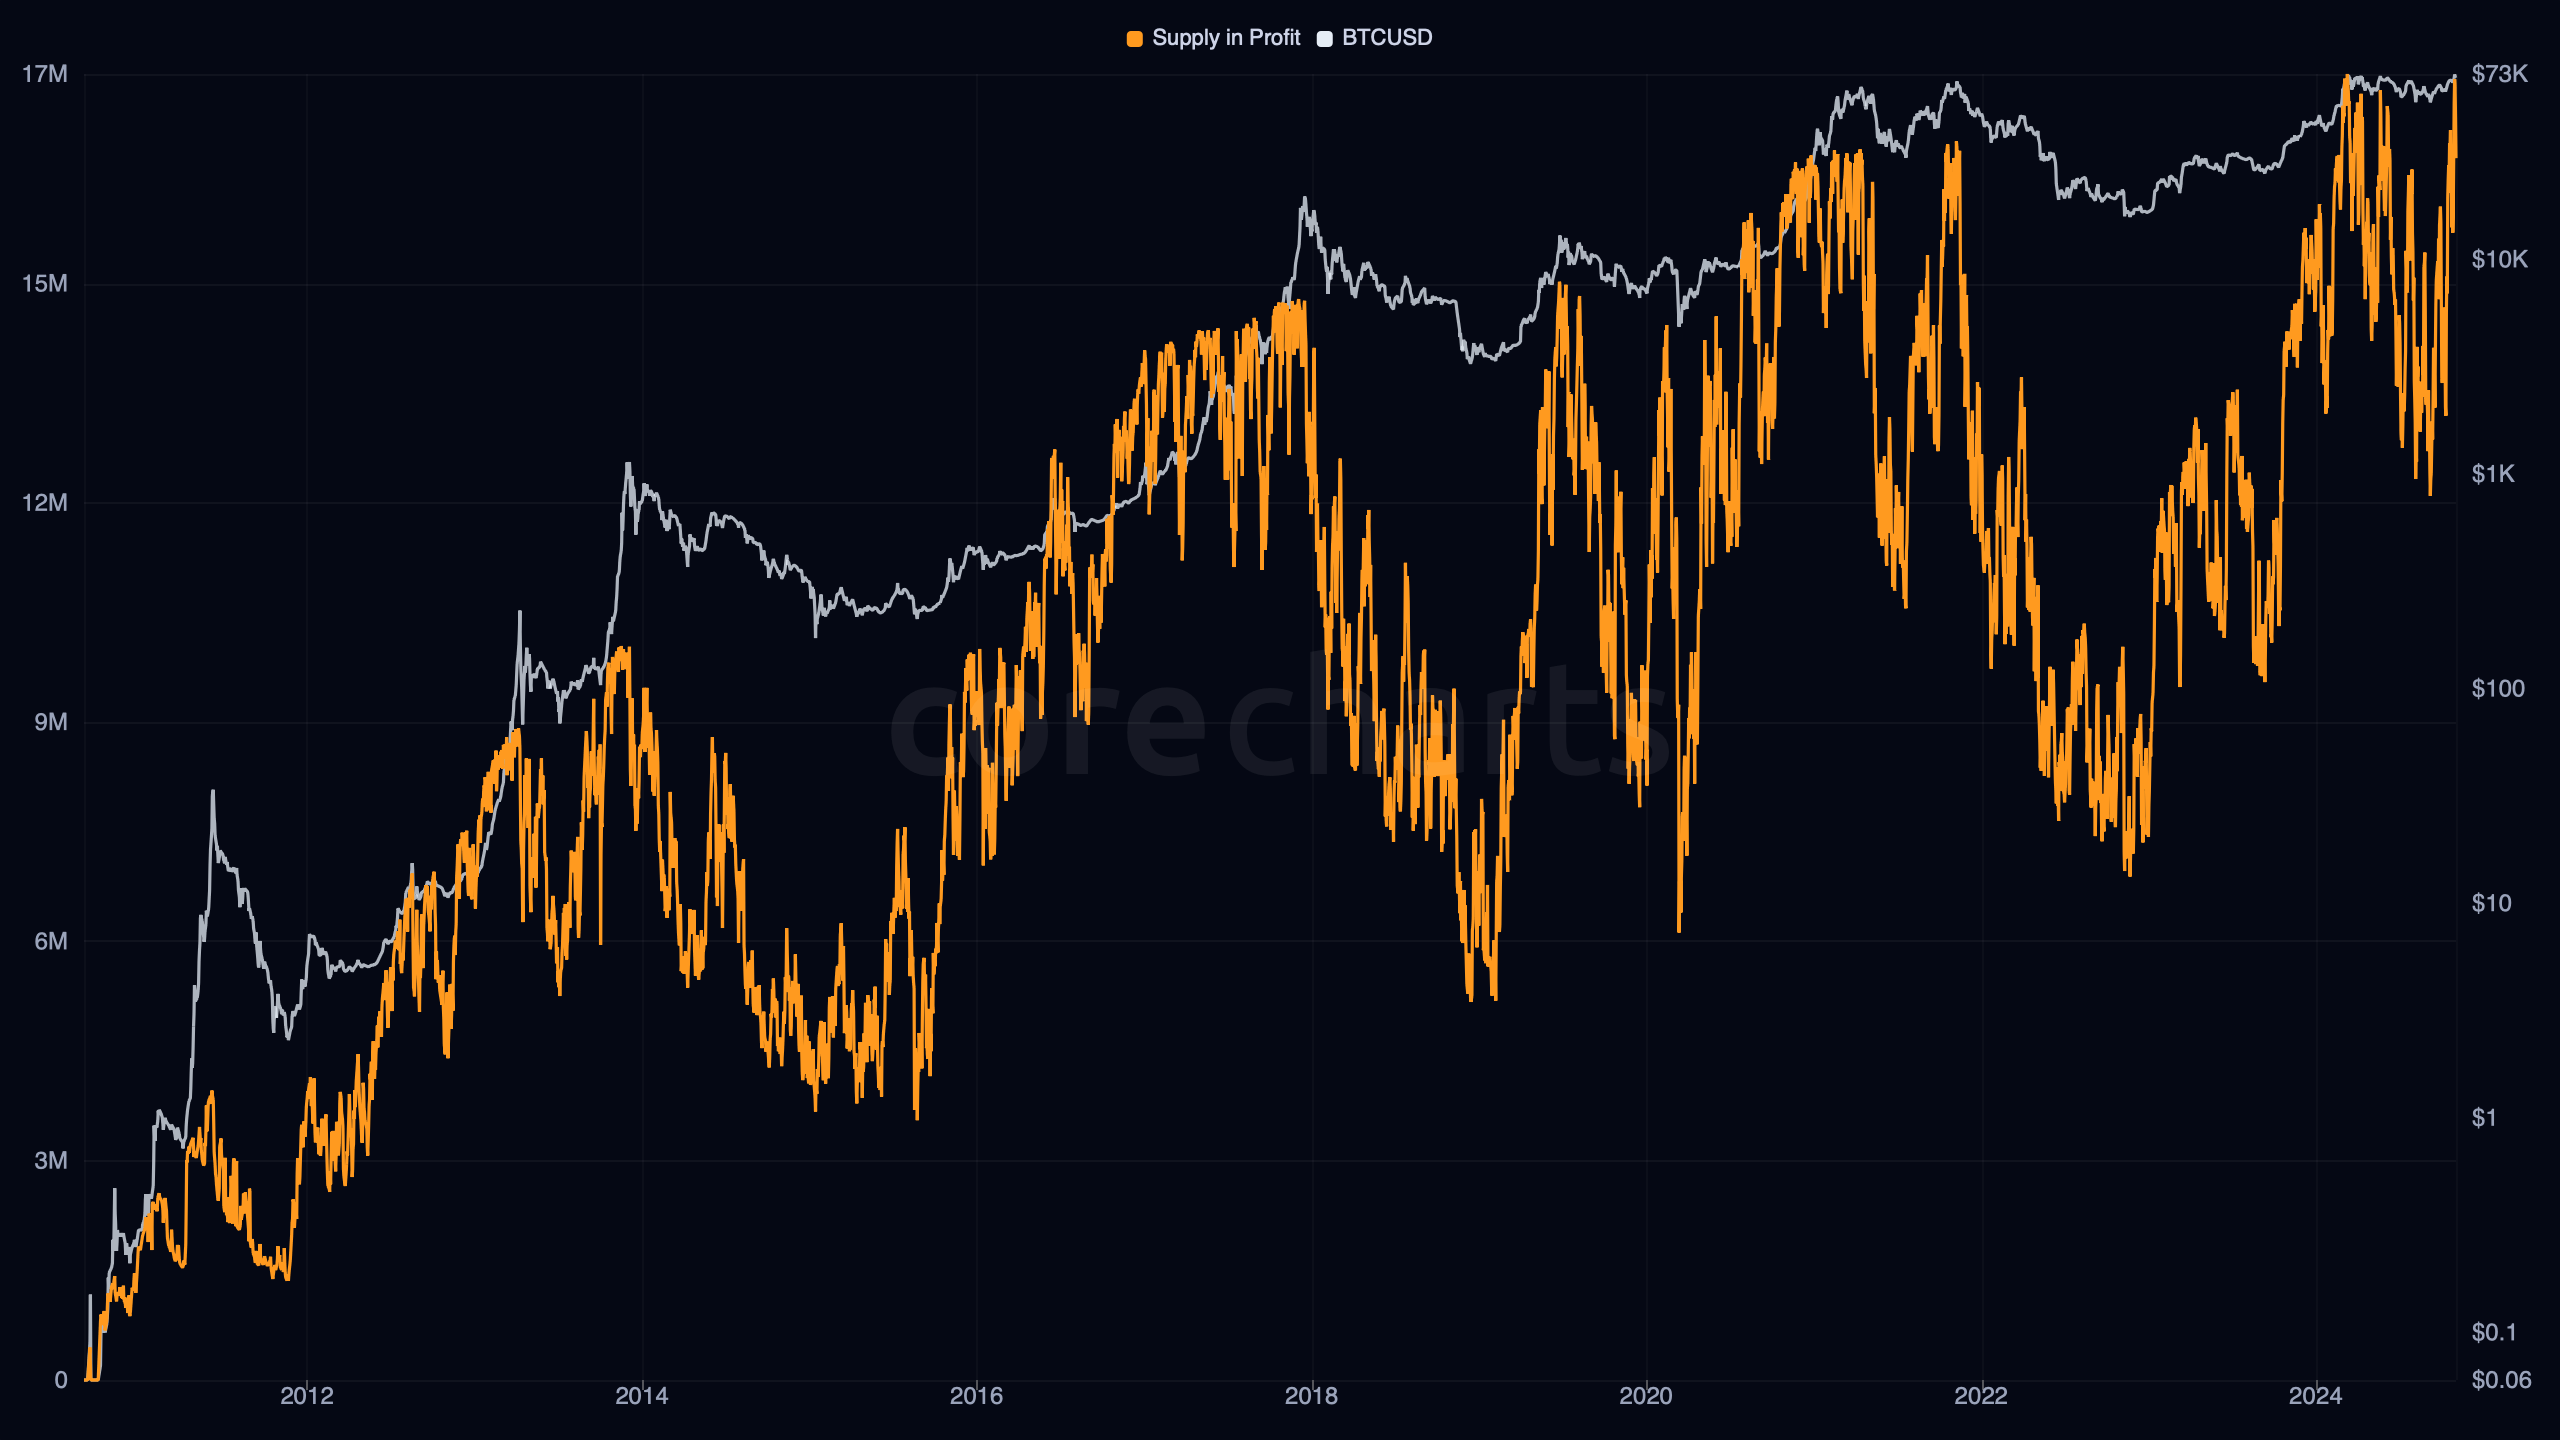
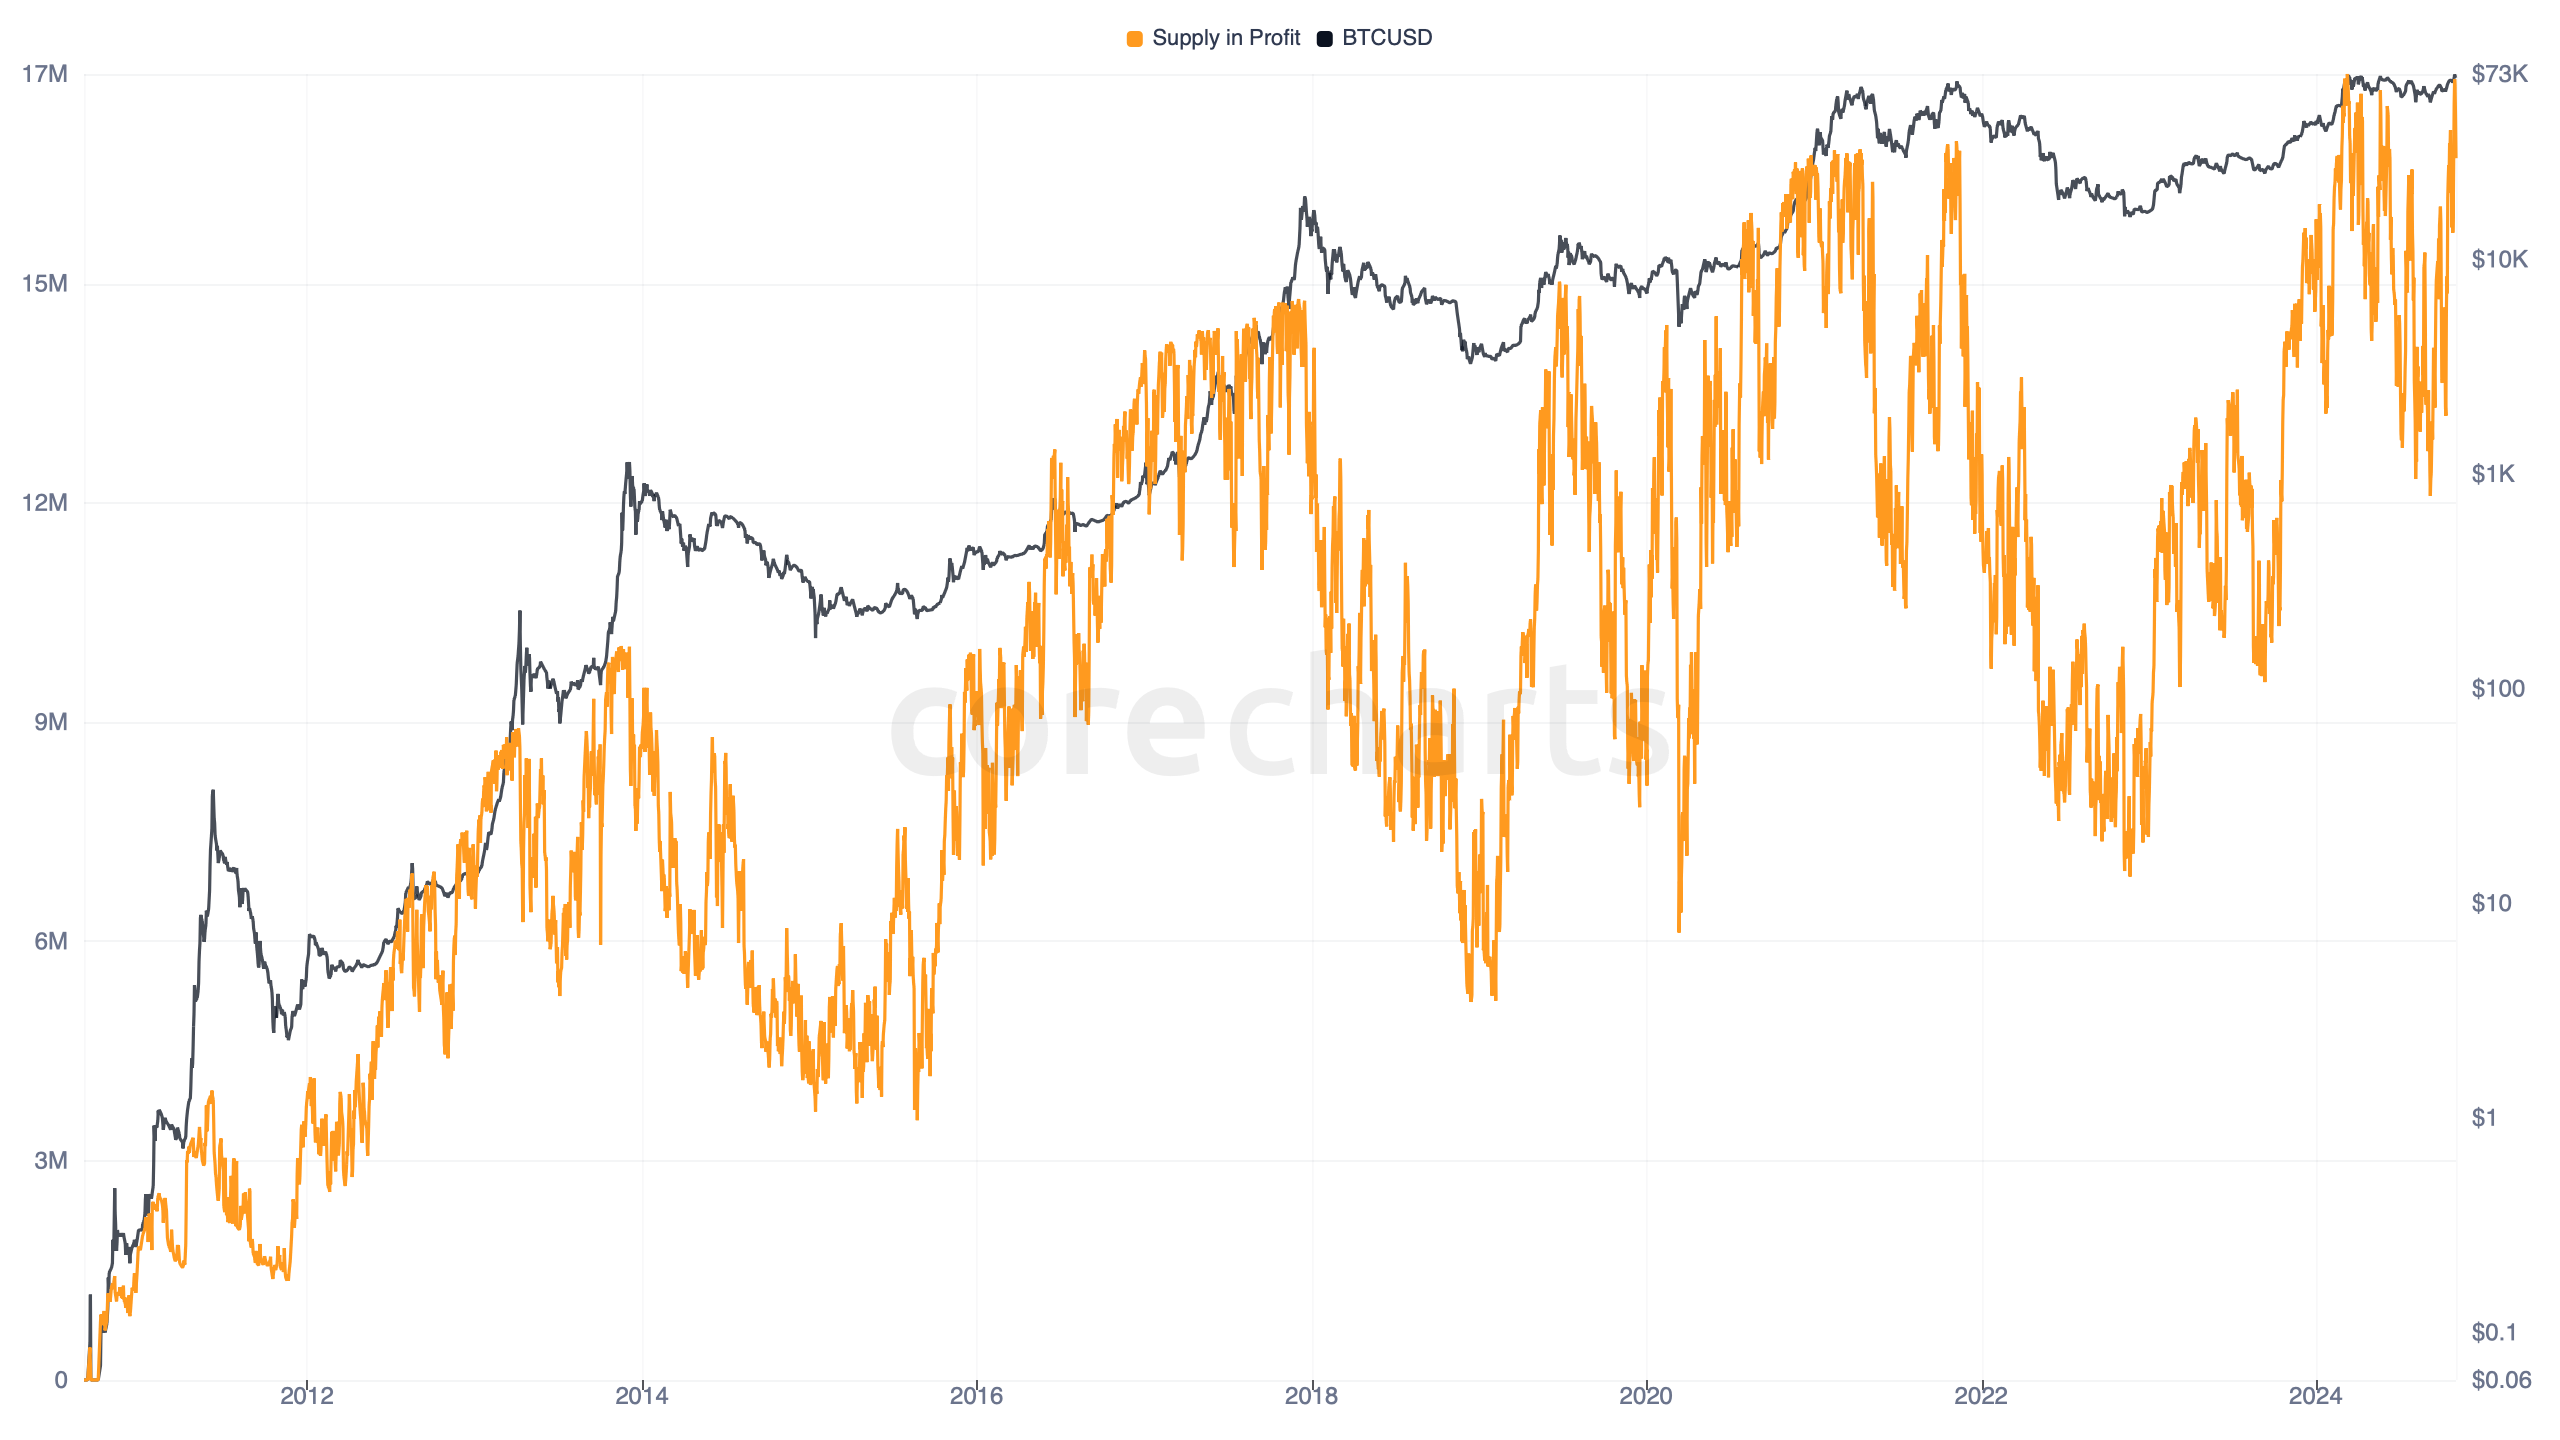
Bitcoin Supply in Profit counts the amount of BTC whose current market price is above the price at which those coins last moved on-chain.
In CoreCharts, the comparison is binary at the coin level. Coins are counted into supply in profit when current daily BTC price is above their realized cost basis. The output is expressed in BTC, not as a ratio or percentage.
This is not unrealized profit in USD. It does not measure how large the embedded gains are. It measures how much supply sits on the profitable side of cost basis.
The metric also differs from Percent Supply in Profit. That version normalizes by total supply. This one stays in native BTC units.
Interpretation#
A rising reading means more of the circulating supply has moved into profit at current price. That can happen because price has advanced above more historical cost-basis bands, or because coins have recently repriced on-chain at lower levels and now sit in gain.
Very high values usually appear after broad upside repricing. Most supply then carries positive mark-to-market P/L, including older coins with low realized prices.
Lower values mean a larger fraction of supply is no longer above cost basis. Price weakness can do that fast. So can heavy on-chain repricing near the current market, which lifts realized bases and leaves less supply with a comfortable gain.
Price And Market Regime#
Profit-Saturated Conditions#
When supply in profit climbs toward the upper end of its range, loss-bearing supply becomes scarce in BTC terms. That often aligns with late bull environments, where upside has pushed price above a wide stack of prior acquisition levels.
The metric is blunt in a good way. Ten million BTC in profit says something different from ninety percent of supply in profit. The absolute version preserves the size of the profitable coin base.
Repricing Around Cost Basis#
Sharp declines often appear during drawdowns that cut through dense cost-basis clusters. Supply that had been in profit can move out of profit quickly when market price breaks below those zones.
Flat periods can still shift the series. Coins spent and repriced near spot change the distribution of realized cost basis even when headline price action looks quiet.
Relationship to other metrics#
Supply in Loss is the direct complement in this family. One rises as the other falls, though neutral supply at exact cost basis can keep the two from summing perfectly.
NUPL tracks the unrealized valuation gap in ratio form. Supply in Profit ignores gain size and counts coin volume. A coin with a small embedded gain and a coin with a huge embedded gain contribute the same BTC amount here.
Realized Cap supplies the cost-basis logic underneath the metric family. Supply in Profit uses that same last-moved pricing idea but keeps the output in BTC instead of USD.
Methodology Note#
CoreCharts builds this series from current daily BTC price versus realized cost basis of existing supply. The result is a supply-state metric, not a spent-volume metric.
That boundary matters against Realized Profit. Supply in Profit refers to coins still outstanding. Realized Profit refers to coins that were actually spent above cost basis on that day.