Bitcoin Long-Term Holder Spent Output Profit Ratio#
Definition#
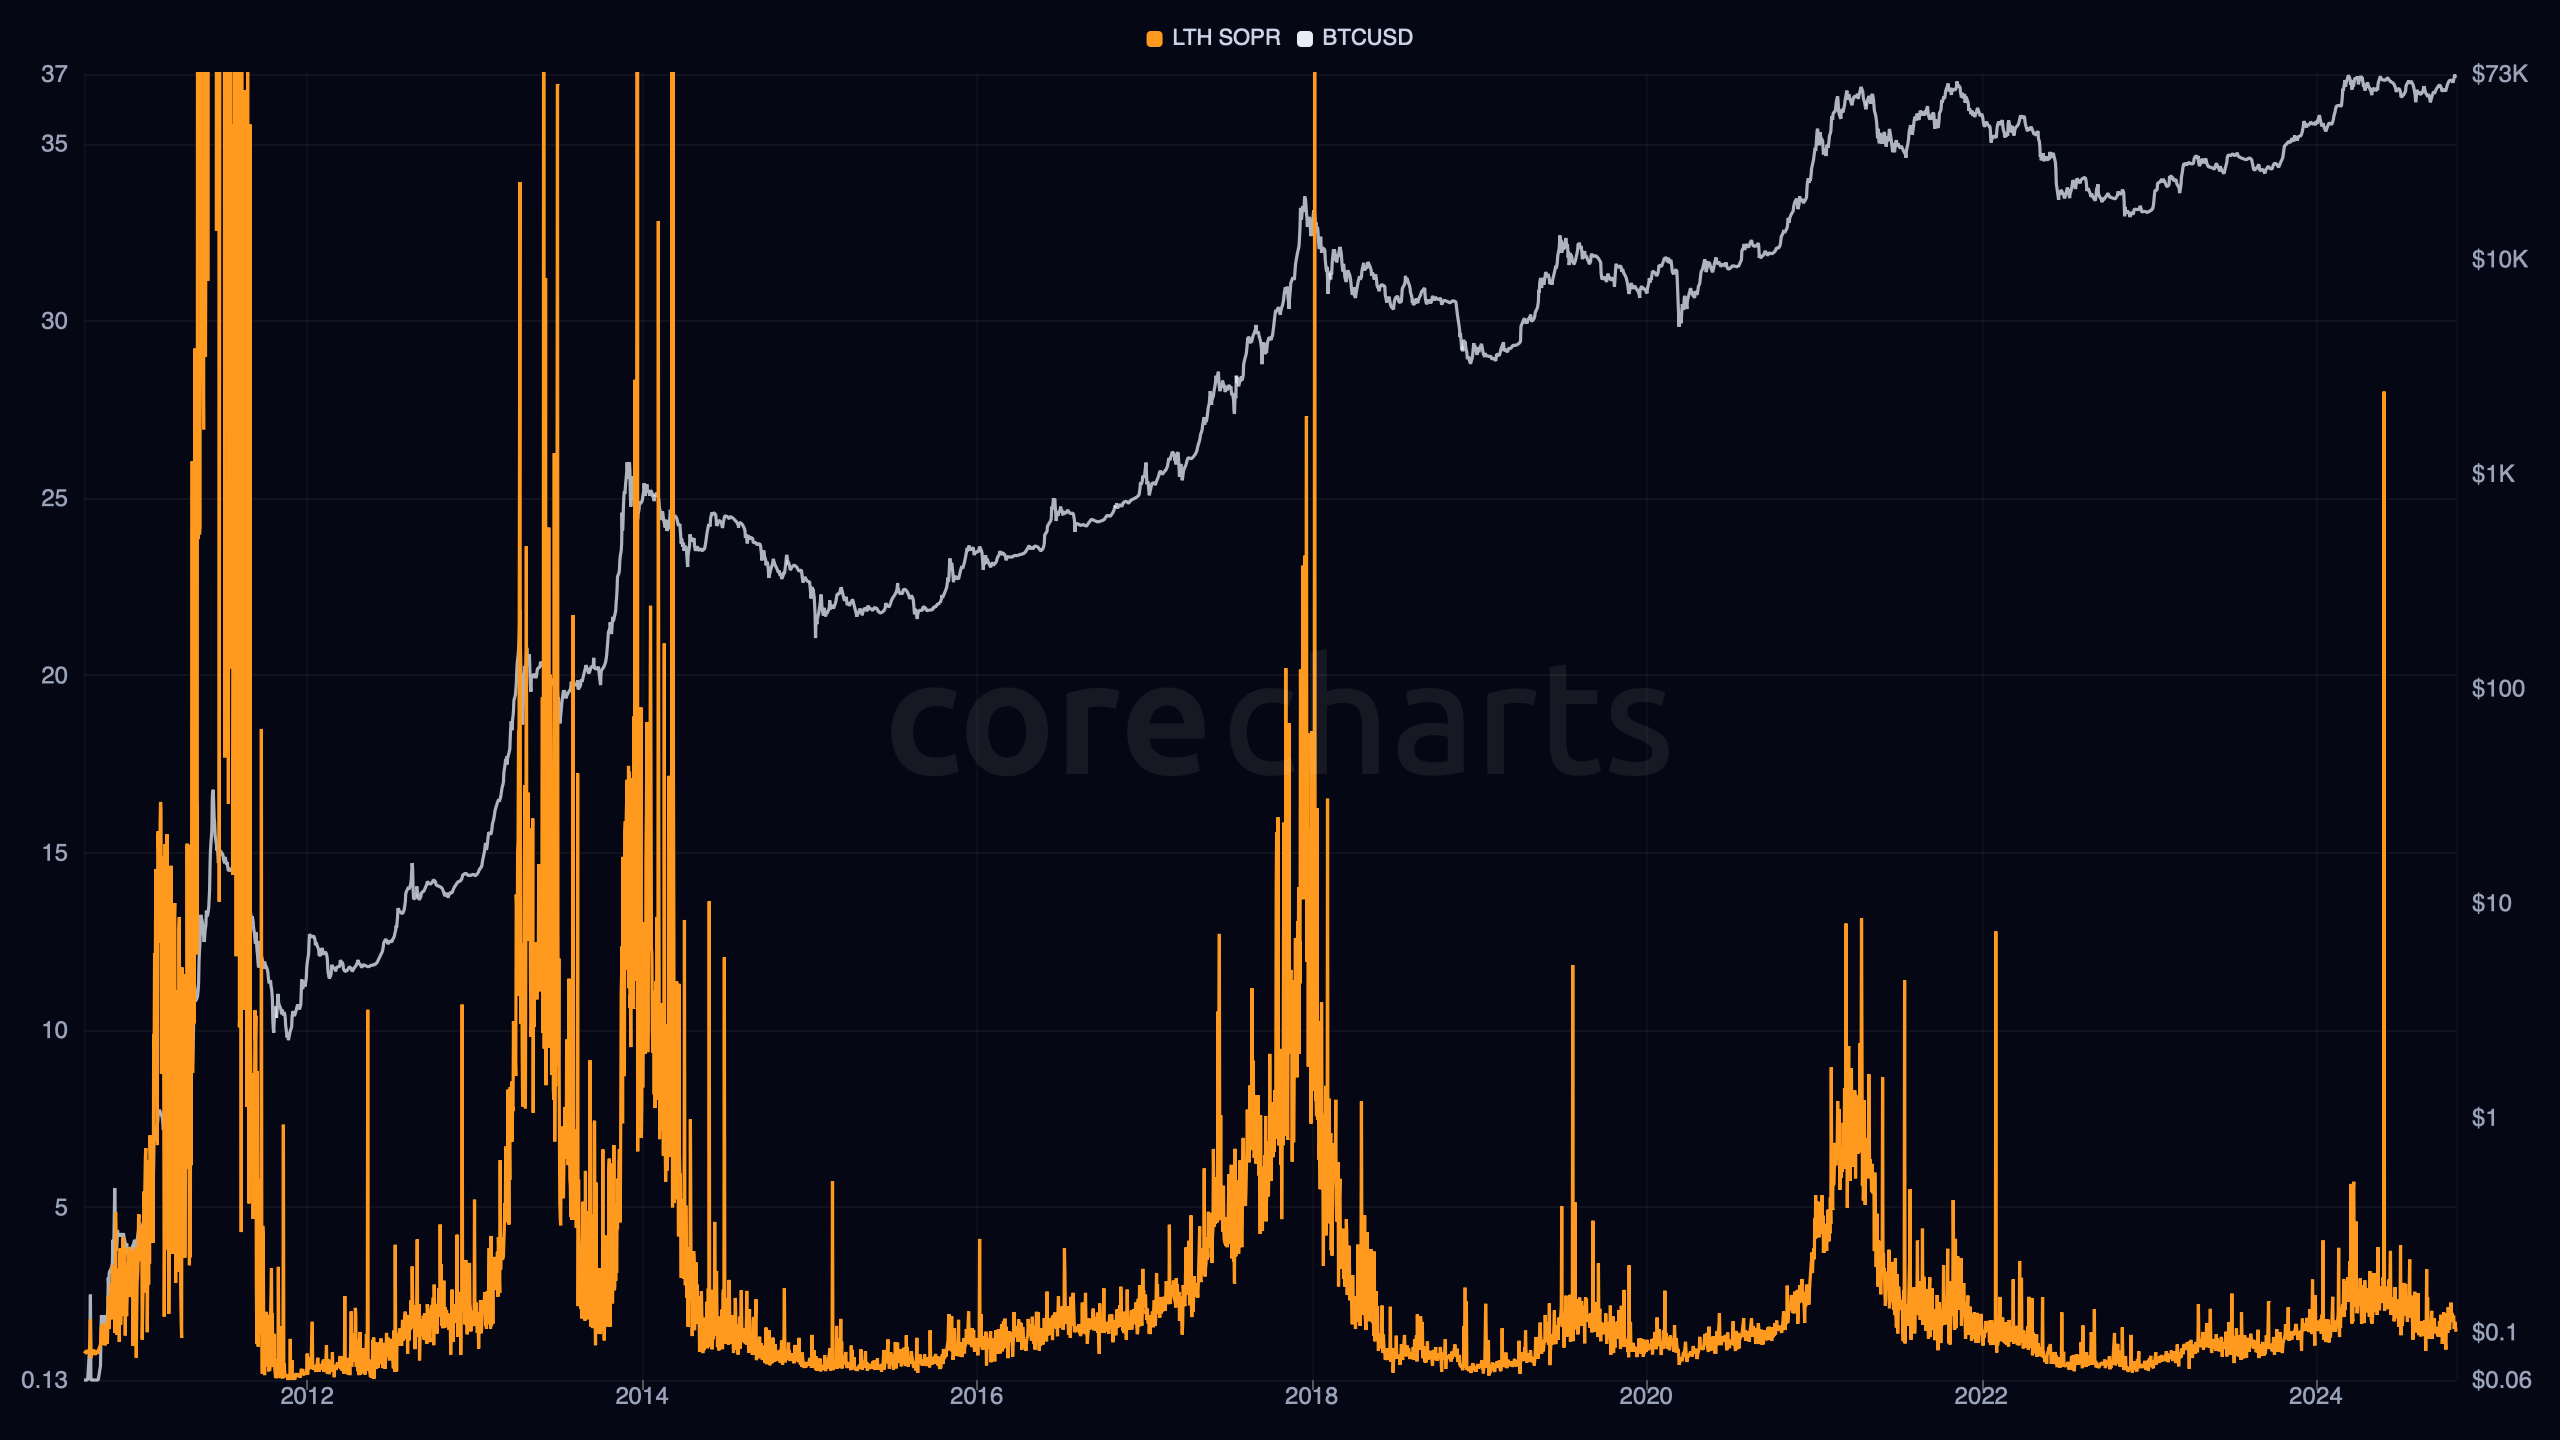
Bitcoin Long-Term Holder Spent Output Profit Ratio applies the SOPR calculation to older spent supply. In CoreCharts, this is the mature-holder side of the SOPR family.
The ratio keeps the same profit-versus-cost-basis logic as aggregate SOPR. What changes is the cohort. The spent outputs are weighted into the long-term side of the holder split, with a soft transition centered around 155 days.
Older coins usually carry a much wider distance between current price and creation price than recent coins do. That gives LTH SOPR a different texture. It is less about day-to-day break-even churn and more about whether mature supply is distributing into strength or realizing loss into weakness.
Interpretation#
High LTH SOPR means older coins are being spent well above cost basis on average. That often coincides with mature-holder distribution, especially when long-dormant supply starts rotating after a strong advance.
Readings near 1 are less common here than in STH SOPR because older supply usually has a larger cost-basis gap. When LTH SOPR approaches 1, the implication is stronger: mature coins are being spent close to their cost basis, not far above it.
Readings below 1 mean older coins are being spent at a loss on average. That condition is rarer and usually marks deep stress, late bear phases, or forced movement from supply that had held through a large drawdown.
Price And Market Regime#
Mature Distribution Regimes#
LTH SOPR tends to stay elevated in strong bull conditions when older holders are selling into demand. The ratio does not need broad panic or broad turnover. A relatively small amount of old supply can move the series sharply because its embedded gains are often large.
This metric is more sensitive to the behavior of seasoned holders than to the behavior of new entrants.
Mature Stress Regimes#
When LTH SOPR falls hard toward 1 or below it, the market is seeing older supply realize much less profit than usual, or outright realize losses. That shift is usually slower and heavier than what shows up first in STH SOPR.
A market can see STH SOPR weaken for weeks while LTH SOPR still holds firm. When both deteriorate together, the weakness is no longer isolated to recent buyers.
Relationship to other metrics#
SOPR blends all moved supply into one series. LTH SOPR keeps only the mature side of spent outputs.
STH SOPR is the faster and more break-even-sensitive counterpart. LTH SOPR usually carries slower turns, larger embedded gains, and fewer false moves around the 1 line.
Realized Profit often rises when LTH SOPR is elevated and old coins are moving, but the two are not interchangeable. The ratio keeps relative profitability. The profit series keeps gross USD magnitude.
Methodology Note#
CoreCharts uses the same soft 155-day maturity transition here as in STH SOPR. The cohort boundary is not a strict hard split.
That choice matters most near the midpoint. It reduces jumpiness from outputs whose age sits close to the long-term holder threshold.